Every ₹1 you spend on Amazon advertising (PPC) drives a potential customer to your listing page. What happens next — whether they buy or bounce — is determined almost entirely by your product listing quality. And the most impactful element of your listing is not your title, not your bullets, and not your price. It is your images.
Research by Amazon itself shows that images account for over 70% of the buyer's decision-making process on product detail pages. For mobile shoppers — who represent 78%+ of Amazon India's traffic — this figure is even higher. This guide gives you the exact framework to use images as a conversion rate optimization lever.
Before diving into strategy, make sure your main image is compliant. See our guide on Amazon India image requirements 2026 to ensure your listings aren't being suppressed.
Section 1
Understanding Conversion Rate and Why Images Drive It
Conversion Rate (CVR) is the percentage of customers who visit your product page and make a purchase. Here's why images are your #1 CVR lever.
CVR = Orders ÷ Sessions × 100. If your listing gets 1,000 sessions per month and 35 orders, your CVR is 3.5% — close to Amazon India's average. To reach 12% CVR, you need to either dramatically improve your listing quality or increase buyer intent through better targeting.
CTR (Click-Through Rate)
How many people click your listing from search. Hero image is the primary driver. A better hero image can 2× your CTR with zero additional ad spend.
Bounce Rate
How many buyers leave your page immediately. If your hero image misrepresents the product, buyers bounce after clicking — wasting your ad budget.
Add-to-Cart Rate
Secondary images convert hesitant browsers into buyers by answering every remaining question before checkout.
The Revenue Math
Consider a listing with ₹800 average order value and 500 monthly sessions from PPC at ₹15/click (₹7,500/month ad spend). At 3.5% CVR: 17.5 orders = ₹14,000 revenue, ROAS of 1.87×. At 10% CVR: 50 orders = ₹40,000 revenue, ROAS of 5.33× — from the exact same ad spend. Optimizing your images is literally equivalent to getting 2.8× more from your marketing budget.
Section 2
The Hero Image Formula for Maximum Click-Through Rate
Your main (hero) image is the first visual a buyer sees — in search results, sponsored ads, and on the product page. It has one job: make the buyer click.
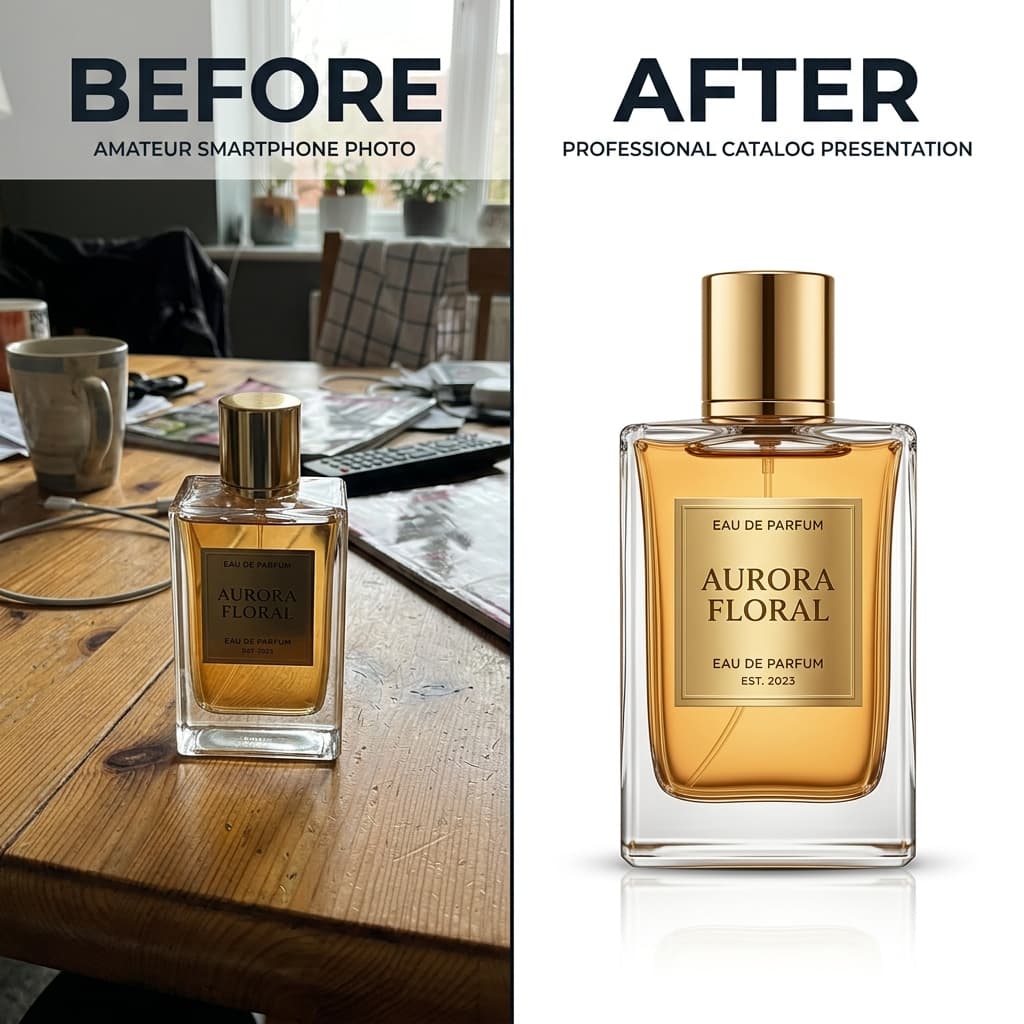
Perfect White Background (Non-Negotiable)
RGB 255, 255, 255 exact white is mandatory for Amazon compliance and also produces the highest CTR in search results. White backgrounds make products pop against Amazon's light-grey search results page.
85%+ Canvas Coverage
Your product should fill 85% or more of the image canvas. Small products surrounded by empty white space look cheap and low-value. Filling the frame communicates confidence in the product.
1600 px Resolution for Zoom
Enable Amazon's hover-zoom feature by using 1600+ px images. Buyers who use zoom convert at significantly higher rates because they've engaged more deeply with the product.
Accurate Color Representation
The product in the image must match the actual product color exactly. Color mismatches are the #1 cause of returns on Amazon India. Accurate colors build trust and reduce post-purchase disappointment.
Single, Clear Product Focus
Show one product (or the exact bundle being sold). Multiple products, props, or accessories not included in the purchase create buyer confusion and suppression risk.
Section 3
The 7-Image Secondary Stack: Your Conversion Engine
Amazon allows up to 7 secondary images per listing. Each one is an opportunity to overcome buyer hesitation and answer unspoken questions. Here's how to use each slot.
| Slot | Image Type | Purpose | Conversion Impact |
|---|---|---|---|
| Slot 1 | Lifestyle Scene | Show product in authentic Indian home/life context | High |
| Slot 2 | Feature Infographic | Highlight 3–5 key product features with callouts | High |
| Slot 3 | Comparison Chart | Show why your product beats the next best option | Medium |
| Slot 4 | Close-up Details | Material texture, quality, finishing details | High |
| Slot 5 | Size / Dimension Chart | Scale reference with dimensions labeled | Medium |
| Slot 6 | In-Use / Demonstration | Product being actively used by real people | High |
| Slot 7 | Trust & Brand Story | Packaging, certifications, warranty information | Medium |
India-Specific Lifestyle Images Convert Best
Indian buyers connect more strongly with lifestyle images featuring Indian settings, Indian faces, and India-relevant contexts. A kitchen appliance shown on a Mumbai apartment counter with Indian spices outperforms the same product in a Western kitchen setting. Use our AI Scene Creator to generate India-specific background scenes in seconds.
Section 4
Mobile-First Image Optimization for Amazon India
78%+ of Amazon India traffic is mobile. Images that look great on desktop may fail completely on a 5-inch Android screen.
Amazon India's buyer base is overwhelmingly mobile — predominantly mid-range Android phones (Samsung Galaxy A-series, Redmi, Realme) with screen sizes between 5–6.5 inches. Optimizing your images for these viewing conditions dramatically improves conversion on the devices your buyers actually use.
Mobile-Optimized Practices
- • Large, readable text on infographic images (min 16px equivalent at display size)
- • High-contrast elements that read well on non-calibrated mobile screens
- • Product fills 85%+ of frame so it reads clearly on 5-inch screens
- • Landscape images: product centered and obvious even as a small thumbnail
Desktop-Only Mistakes
- • Small text in infographics that's illegible on mobile
- • Complex collage images with many small elements
- • Busy lifestyle scenes where product is lost in the background
- • Watermark or badge overlays covering important product areas
The thumbnail test: Before publishing, view your main image at 100×100 px (about the size Amazon shows it in dense search results). If the product is clearly visible and recognizable at this size, it will perform well in mobile search results. If it looks like a blurry blob, the image needs to be reframed with the product closer and larger in the frame.
Section 5
A/B Testing Your Amazon Product Images
The only way to know which image truly converts better is to test. Amazon provides native tools for brand-registered sellers to run image experiments.
How to Use Amazon's Manage Your Experiments
- 1Navigate to Seller Central → Brands → Manage Your Experiments
- 2Select 'Product Images' as the experiment type
- 3Choose the ASIN you want to test and upload two image versions
- 4Amazon automatically splits traffic 50/50 between the two versions
- 5Wait 4–8 weeks for statistical significance, then pick the winner
What to Test for Indian Seller Listings
Hero Image Angle
Front-facing vs. 45-degree angle often produces dramatically different CTR results depending on product category.
India-Context Lifestyle vs. Generic
Test an Indian lifestyle scene vs. a plain white or Western lifestyle scene in secondary slot 1.
Feature Infographic vs. Close-up
Test whether buyers respond better to feature callouts or detailed material close-up shots in secondary slot 2.
With Model vs. Ghost Mannequin
For fashion categories, test real model shots vs. ghost mannequin to determine which drives more conversions in your category.
Section 6
AI Tools for Amazon Image Conversion Optimization
Creating and testing optimized images used to take weeks and thousands of rupees in studio costs. AI has compressed this to minutes and near-zero cost.
The biggest constraint on image A/B testing for most Indian sellers is the cost and time of creating multiple image versions. With AI tools, you can create, iterate, and test multiple image concepts in the same afternoon.
White Studio
Create compliant hero images from any phone photo in 60 seconds. Perfect for generating multiple variations to test different product angles.
ExploreScene Creator
Generate India-specific lifestyle backgrounds automatically. Test which scene type (kitchen, bedroom, outdoor, urban) converts best for your product.
ExploreFashion Model
Place clothing on virtual AI models. Test different model demographics and styling to find what resonates most with your target Indian buyer.
ExploreGallery & Templates
Browse proven background and scene templates. Start with what's already working for products similar to yours.
ExploreStart Optimizing Today
Turn Your Listings into Conversion Machines
Better images are the fastest, cheapest lever for increasing Amazon India revenue — with no additional ad spend required. Start with your top 5 ASINs and see the CVR difference within weeks.
FAQ
Frequently Asked Questions
How much can product images impact Amazon conversion rate?
Images can improve CVR by 20–60% compared to basic listings. Amazon India's average CVR is 3–4%, while top-optimized listings achieve 12–18%. The hero image alone can 2× your click-through rate from search results.
What type of secondary images increase Amazon CVR the most?
Lifestyle images showing the product in authentic Indian use context consistently drive the highest conversion improvements. Feature infographic images are the second most impactful type, followed by close-up detail shots.
How do I A/B test Amazon product images?
Use Amazon's 'Manage Your Experiments' in Seller Central (available for Brand Registry sellers). It allows testing two image versions on the same ASIN, split 50/50 by traffic, with statistical reporting on which version converts better.
Do I need Brand Registry to optimize images on Amazon India?
Brand Registry is required for Amazon's Manage Your Experiments A/B testing tool and for A+ Content (enhanced brand content). However, you can optimize all 8 image slots (1 hero + 7 secondary) without Brand Registry, and this alone drives significant CVR improvement.
How long does it take to see results from image optimization?
CVR improvement is typically measurable within 1–2 weeks of updating your hero image. Secondary image improvements may take 3–4 weeks for statistically significant data in Seller Central reports.
Complete your image strategy