Most Amazon India sellers are fighting the wrong battle. They obsess over keyword density, backend search terms, and PPC bids — while ignoring the one thing that A10 cares about most: do buyers actually buy when they land on your listing?
A10 changed the rules. It's not enough to match a keyword anymore. You need buyers to click, stay, and convert. That journey starts and ends with your product images. See also: Amazon India image requirements 2026 and how to increase Amazon conversion with product images.
Section 1
What Is the Amazon A10 Algorithm?
Amazon's A10 algorithm is the ranking system powering Amazon.in search results. It's a significant departure from its predecessor A9 — and understanding the difference is essential for any Indian seller competing in 2026.
Amazon quietly rolled out the A10 algorithm from 2022 onward. The defining shift: A10 moved from being primarily a keyword-match engine (A9) to a commercial intent and quality engine. In simple terms, A9 asked “does this listing contain the search keyword?” A10 asks “does this listing actually sell well?”
A10 vs A9: Key Differences
| Ranking Factor | A9 Weight | A10 Weight |
|---|---|---|
| Keyword relevance | Very High | Medium |
| Sales velocity | High | Very High |
| Click-through rate | Low | High |
| Conversion rate | Medium | Very High |
| External traffic | Very Low | High |
| Customer reviews | High | High |
| Organic sales ratio | Low | High |
| Listing completeness | Medium | High |
The old A9 rewarded sellers who were good at keyword stuffing. A10 rewards sellers whose listings actually sell. This is a fundamental shift — and it's why optimizing images (which drive both CTR and conversion) became a MORE powerful ranking lever than any keyword strategy after A10 launched.
Sales Velocity
How many units you sell per day. A10 interprets rapid sales as proof the listing is high-quality.
Click-Through Rate
What % of searchers click your listing. Low CTR = A10 interprets the listing as not relevant.
Conversion Rate
% of visitors who buy. A10's strongest signal — a buyer who purchases is a definitive quality vote.
External Traffic
Visitors arriving from Google, Instagram, WhatsApp. A10 rewards you for bringing traffic Amazon didn't pay for.
Section 2
How Images Became A10's Most Powerful Ranking Signal
Amazon's A10 algorithm doesn't 'see' your images — but it measures the buyer behavior that your images cause. And that's the same thing.
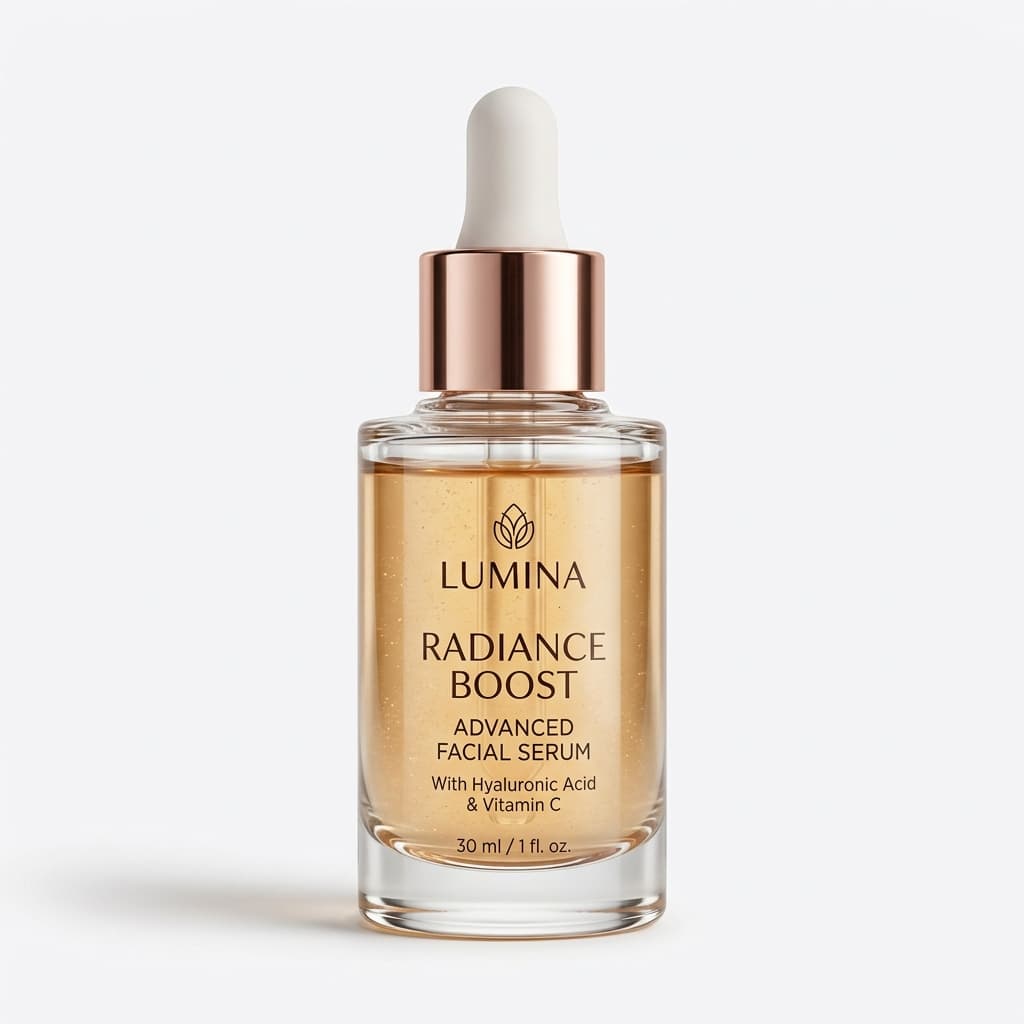
Amazon's algorithm measures CTR from search impressions per keyword. A listing with 5% CTR outperforms a listing with 2% CTR for the same keyword — A10 reads the higher CTR as a “relevance and quality” signal and bumps the rank. Over time, this compounds: higher rank → more impressions → more clicks → even higher rank.
Search Results = Image is Everything
At the search results stage, buyers see exactly four things about your listing: title snippet, price, rating stars, and the thumbnail image.
Title and price are often similar across competing listings. Rating stars take months to build. The thumbnail image is the only thing you can improve overnight to dramatically increase CTR.
Data from Amazon seller communities and listing optimization studies consistently show that listings with optimized main images — pure white background, 85%+ product fill, 1600px resolution for zoom enablement — get 40–60% higher CTR versus non-optimized listings for the same keywords.
The CTR Compounding Loop
Section 3
CTR Deep Dive: How Amazon Measures and Uses Click-Through Rate
Click-Through Rate is Amazon A10's proxy for relevance. Understanding exactly how it works gives you a clear playbook for improving it.
When a buyer searches for “steel water bottle 1 litre” and scrolls past your listing without clicking, that's a signal to A10: “this listing is probably not the best result for this keyword.” If enough buyers do this, A10 demotes your rank for that keyword — regardless of how well-optimized your backend keywords are.
CTR Benchmarks for Amazon India (2026)
1–3%
Baseline
Average. Your listing is visible but not compelling. Improvement needed.
3–5%
Strong
Well-optimized. Your thumbnail is doing its job. A10 will maintain or improve your rank.
5%+
Excellent
Top-tier. Reserved for listings with exceptional images and very strong brand recognition.
How to Check Your CTR in Seller Central
Go to Reports → Business Reports → Detail Page Sales and Traffic to see session and page view data. For keyword-level CTR, navigate to Advertising → Campaign Manager → Reports → Search Term Report. Look for the “Click-Through Rate” column — this tells you exactly which keywords have low CTR (and therefore risk demotion).
A better hero image that clearly communicates the product's value proposition at thumbnail size (roughly 160×160px on mobile) directly prevents the demotion loop. This means your main image must be readable, punchy, and product-forward even at a quarter of its actual size.
Section 4
Conversion Rate: A10's Most Trusted Ranking Signal
After the click, A10 watches what buyers do next. A buyer who purchases is the strongest positive signal possible. A buyer who bounces is a negative one.
A10 tracks session quality. A buyer who clicks your listing, scrolls through your images, reads your bullets, and then adds to cart sends a strong positive signal. A buyer who clicks, stays 15 seconds, and hits the back button contributes to your “bounce” — a negative session quality signal that A10 uses to determine whether your listing deserves its current rank.
What Images Answer That Would Otherwise Cause Abandonment
Real Revenue Impact: ₹20,000 Extra Per Month
| Scenario | Before (Poor Images) | After (Optimized Images) |
|---|---|---|
| Product price | ₹1,000 | ₹1,000 |
| Monthly sessions | 500 | 500 |
| Conversion rate (CVR) | 4% | 8% |
| Monthly orders | 20 | 40 |
| Monthly revenue | ₹20,000 | ₹40,000 |
Doubling your CVR from 4% to 8% by improving your image stack adds ₹20,000 extra monthly revenue — on the exact same traffic and ad spend. And the higher CVR also improves your A10 rank, increasing organic traffic over time.
Section 5
7-Step Image Optimization Plan for Amazon India
A systematic checklist to optimize every Amazon India listing image for maximum CTR and CVR — both direct A10 ranking signals.
RGB 255,255,255 Exact White Background on Main Image
Amazon mandates pure white. Non-compliant images risk suppression. But beyond compliance, pure white thumbnails pop against Amazon's grey search grid — directly boosting CTR.
Get exact white bg →1600px Minimum Resolution on All Images
1600px enables Amazon's zoom feature. Buyers who zoom convert at 2× the rate of buyers who can't. Zoom engagement also increases time-on-page — a positive A10 session signal.
85%+ Canvas Fill on Main Image
A product that fills the frame stands out in the search grid. Small products floating in empty white space lose thumbnail clarity and get scrolled past. Aim for the product to occupy at least 85% of the image area.
Fill All 8 Image Slots
Amazon allows 9 images total. Each additional image increases on-page dwell time. Listings with 8+ images consistently have 30–40% higher CVR than listings with 3–4 images. More images = more answered questions = more confidence = more purchases.
Infographic in Image Slot 2
Your second image is seen by every buyer who clicks. Put a features infographic here — key specs, size comparison, material callouts. This answers the most common buyer question without requiring them to read your bullets.
Lifestyle Image in Image Slot 3
The third image creates emotional connection. Show your product being used in a recognizably Indian context — Indian kitchen, Indian home, Indian lifestyle. Emotional resonance drives add-to-cart decisions far more than feature lists.
A/B Test with Manage Your Experiments
Amazon's native A/B testing tool lets you test two versions of your main image (or title) with statistical significance. Run tests for 4 weeks minimum. Double down on the winner. This is the only way to optimize systematically rather than by guesswork.
Steps 1–3 in 30 seconds with Seller AI Studio
Upload any product photo — even a phone photo with a messy background — and Seller AI Studio's White Studio delivers exact RGB255 white background, proper canvas fill, and 1600px resolution. Zero manual editing.
FAQ
Frequently Asked Questions
What is Amazon A10 vs A9?
A9 was Amazon's original ranking algorithm focused heavily on keyword matching — the more keywords in your listing, the better. A10, rolled out from 2022, places much greater weight on external traffic (from Google, social media), conversion rate, sales velocity, and organic sales ratio. The result is that high-conversion listings with great images rank better than keyword-stuffed listings with poor images.
Do product photos directly affect Amazon ranking?
Yes, absolutely. Product photos affect two of A10's top ranking signals: Click-Through Rate (CTR) from search results, and Conversion Rate (CVR) after the click. Both are heavily influenced by image quality. A better main image raises CTR; a complete image stack raises CVR. Both directly improve your A10 ranking — which is why image optimization is now more impactful than keyword optimization for most Indian sellers.
How can I check my CTR on Amazon India?
In Seller Central, go to Reports → Business Reports → Detail Page Sales and Traffic for overall session data. For keyword-level CTR, go to Advertising → Campaign Manager → Reports → Search Term Report. Download the report and look for the Click-Through Rate column. Any keyword with CTR below 1% is a red flag — your image isn't compelling enough for that search intent.
How many images should my Amazon listing have?
Amazon allows up to 9 images (1 main + 8 secondary). You should fill all 9 slots. Each additional image increases time-on-page, which is a positive session quality signal for A10. The recommended stack: (1) Hero white bg, (2) Features infographic, (3) Indian lifestyle in use, (4) Dimensions/size chart, (5) Materials/quality close-up, (6) Back or alternative angle, (7) Packaging, (8) Comparison or FAQ graphic. Listings with 8+ images consistently outperform those with 3-4 images.
Ready to rank higher?
Rank Higher on Amazon India with Better Product Images
Every day you run listings with non-optimized images, you lose CTR to competitors, suppress your own A10 ranking, and leave conversion revenue on the table.
Seller AI Studio gives Indian Amazon sellers instant access to RGB255 white backgrounds, zoom-ready resolution, and lifestyle scene generation — all from a phone photo.